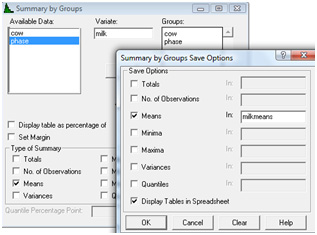
Data managementHowever, the regression analysis needed to compare associations between mean milk yields and concentrates in individual phases will require mean values first to be calculated for each cow. We shall prepare this data file CS6Data3 now. We start with Stat → Summary Statistics → Summaries of Groups (Tabulations)…, and put the variable milk into the 'Variate' box and cow and phase into the 'Groups' box. Then, by clicking the 'Save' button, storing the means in the variable milkmeans, and clicking the 'Display Tables in the Spreadsheet' box (see dialog box below), we can obtain a 2-way table of means displayed on the screen.
|
![]()
![]()
![]()